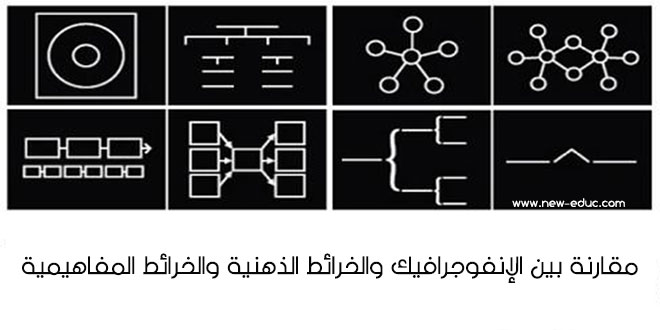
مقارنة بين الإنفوجرافيك والخرائط الذهنية والخرائط المفاهيمية
ويعرف كذلك علم الإنفوجرافيك بفن تحويل المعلومات والأفكار المعقدة إلى صور ورسوم مشوقة يمكن فهمها واستيعابها بسهولة أكثر، وهو أسلوب يتميز بعرض المعلومات المعقدة والصعبة بطريقة سلسة وسهلة وواضحة للقارئ من خلال المثيرات البصرية بطريقة قصصية أو روائية.
وقد عرف (توني بوزان ، 2009، 15) الخرائط الذهنية على أنها شكل طبيعي يتفرع من الشكل المركزي وتستخدم فيها الرموز والكلمات والصور، وفق مجموعة بسيطة من العلاقات والروابط التي يفضلها العقل، تكون بمثابة أداة تفكير يستخدمها المتعلم في رسم مخطط بصري يوضح مكونات الموضوع أو الأفكار الرئيسة والفرعية، لتساعد في تسريع التعلم واكتشاف المعرفة بصورة أفضل، وتنمية عمليات التذكر والتحليل والتخيل والتفكير البصري للمتعلم، من خلال ترتيب الأفكار، وسرعة التعلم، واسترجاع المعلومات (FREY,2016)، تمكن المتعلم من إظهار الترابطات والعلاقات فيما بينها (Beavers ,2014).
وتعتبر الخرائط الذهنية وسيلة خلاقة ومنطقية لتدوين الملاحظات من خلال تمثيلات غير خطية، لديها هيكل تنظيمي، توضع فيه الفكرة الرئيسية بالمركز، وتستخدم الخطوط والرموز والكلمات والألوان والصور لربطها بالأفكار الفرعية وإظهار العلاقات وفقا لأسلوب سلس وبسيط، يعمل بما يتماشى مع الدماغ الطبيعية للقيام بهذه الأمور لتصورها وتخيلها وتكوين الارتباطات بين الفكرة الرئيسية والأفكار الفرعية التي تنبثق من الموضوع الرئيسي (Cuthell & Preston, 2008).
وتكون خرائط المفاهيم على شكل مخطط يتكون من دوائر أو مربعات و أسهم لإظهار العلاقات بين المفاهيم، ويكون على كل سهم كلمات لتوضيع نوع العلاقة والارتباط بين المفاهيم بعضها البعض (Novak & Cañas , 2008).
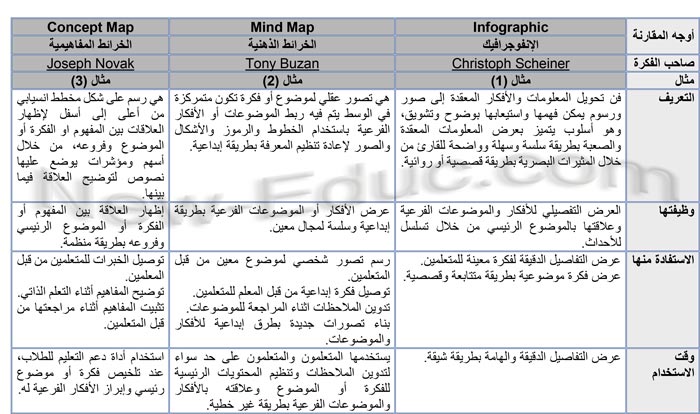
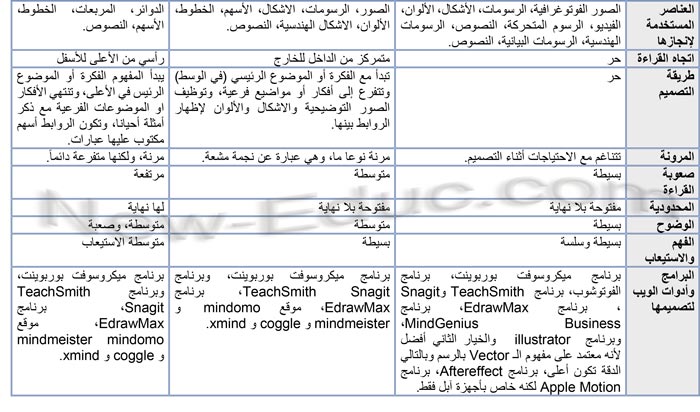
مثال (1): الإنفوجرافيك Infographic

مثال (2): الخرائط الذهنية Mind Map
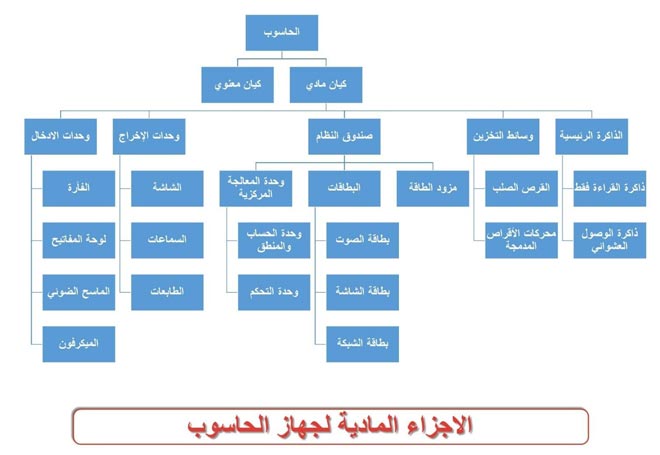
مثال (2): الخرائط المفاهيمية Concept Map
– Biktimirov, E. N., & Nilson, L. B. (2006). Show Them the Money: Using Mind Mapping in the Introductory Finance Course. Journal of Financial Education, 32(Fall), 72-86.
– Boukobza P. (2016). Mind or Concept Mapping: Differences and Similarities.
http://www.visual-mapping.com/2013/04/mind-or-concept-mapping-differences-and.html
– Buzan, T., & Buzan, B. (2000). The Mind Map Book. London: BBC Books.
– Cuthell, J. P.; Preston, C. (2008) Multimodal Concept Mapping in teaching and learning: a MirandaNet Fellowship project. In: Carlsen, R., McFerrin, K., Weber, R., Willis, D. A. (Eds.), Proceedings of SITE 2008 (pp. 1999 – 2007) Norfolk, VA: Association for the Advancement of Computing in Education
– Davies, Martin. 2011. Concept Mapping, Mind Mapping and Argument Mapping: What Are the Differences and Do They Matter? Higher Education 62 (3): 279-301.
– Eppler M. (2006). A comparison between concept maps, mind maps, conceptual diagrams, and visual metaphors as complementary tools for knowledge construction and sharing. Information Visualization (2006) 5, 202 –210
– FREY C. (2016(1)). Concept maps vs. mind maps.
http://mindmappingsoftwareblog.com/concept-maps-vs-mind-maps
– FREY C. (2016(2)). 5 ways studying infographics can make you a better mind mapper.
http://mindmappingsoftwareblog.com/infographics-and-mind-mapping/
– Mohiuddin,F. & Chhutani,F. (2013). The Art & Science of Infographics . STC India’s 15th Annual Conference,The Zuri White Sands, Varca, Goa
– NMS, Neo Mammalian Studios (2013). The 8 types of infographic. NeoMam Studios. Manchester.
http://neomam.com/infographics/the-8-types-of-infographic/
– Novak J. & Cañas A. (2008) The Theory Underlying Concept Maps and How to Construct and Use Them, Technical Report IHMC CmapTools 2006-01 Rev 01-2008, Florida Institute for Human and Machine Cognition, 2008, available at: – http://cmap.ihmc.us/Publications/ResearchPapers/TheoryUnderlyingConceptMaps.pdf
– Parikh N (2015). Mind Map and Concept Map as Complementary Tools for Teaching. The International Journal of Indian Psychology ISSN 2348-5396 (e) | ISSN: 2349-3429 (p) Volume 2, Issue 4, DIP: B00314V2I42015
– Saavedra F. and Lozano L. (2013). Planetary Science Multimedia: Animated Infographics For Scientific Education And Public Outreach. 44th Lunar And Planetary Science Conference.
– Tolisano,S. (2012).Grating Infographics. Silvia Rosenthal Tolisano blog.
http://langwitches.org/blog/
– TT, TechyTeacher (2012). Infographics. techy teacher – what the tech?. Saskatoon Public Schools.
http://schools.spsd.sk.ca/curriculum/techyteacher/2012/01/15/infographics/
– Vanides J. Yin Y., Tomita M., and Ruiz-Primo M. (2005). Using concept map in the Science Classroom. National Science Teachers Association (NSTA). Reprinted with permission from Science Scope, Vol. 28, No. 8
– Zeilik M.(ND). Classroom Assessment Techniques
– Concept Mapping. Department of Physics & Astronomy. University of New Mexico.
http://www.flaguide.org/cat/conmap/conmap1.php


 2 التعليقات